RSI Explained: How to Read the Relative Strength Index and Screen 50+ Coins at Once
The Relative Strength Index (RSI) is the single most-used momentum indicator in crypto trading — and also one of the most misunderstood. Traders reach for it to spot tops and bottoms, confirm trends, and time entries, but very few use it the way its inventor intended, and fewer still know how to apply it across an entire market at once.
This guide covers RSI from the ground up: what it measures, how it's calculated, how to read it correctly in fast-moving crypto markets, the strategies that actually work, the traps that catch beginners — and how to stop checking coins one chart at a time by using an RSI heatmap.
What is the RSI?
The Relative Strength Index is a momentum oscillator developed by J. Welles Wilder Jr. in 1978. It measures the speed and magnitude of recent price changes and expresses that as a single number between 0 and 100.
Crucially, RSI does not track price — it tracks momentum. A coin can keep making higher highs while its RSI falls, and that disagreement is exactly what makes the indicator useful. RSI answers a different question than the price chart: not "where is price?" but "how much strength is behind this move?"
How RSI is calculated
RSI is built from the average of recent gains versus the average of recent losses over a lookback period — by default 14 candles.
The formula is:
RSI = 100 − ( 100 / ( 1 + RS ) )

where  RS = Average Gain / Average Loss  (over the last 14 periods)
In practice:
- For each candle, record whether price closed up or down versus the previous close.
- Average the up-moves and the down-moves separately over the 14-period window.
- Divide average gain by average loss to get RS (relative strength).
- Normalize RS into the 0–100 range with the formula above.
Because it's a ratio of gains to losses, RSI naturally compresses into 0–100: a reading of 100 would mean price rose on every one of the last 14 candles; a reading near 0 means it fell on nearly all of them.
The 14-period default is what Wilder used, and it remains the standard. Shorter settings (say 7) make RSI more sensitive and produce more signals; longer settings (21+) smooth it out and reduce noise.
How to read RSI: overbought, oversold, and the centerline
Three levels matter:
- 70 and above — overbought. Momentum to the upside has been strong and may be stretched. This is not an automatic sell signal.
- 30 and below — oversold. Momentum to the downside has been strong and may be exhausted. This is not an automatic buy signal.
- 50 — the centerline. Above 50, average gains outweigh average losses (bullish momentum); below 50, the reverse. Many trend traders use the 50 line as their primary bull/bear divider and ignore 70/30 entirely.
The most important thing to internalize: overbought does not mean "about to fall," and oversold does not mean "about to rise." These are conditions, not signals. In a strong trend, an asset can remain overbought for weeks.
RSI in crypto specifically
Wilder designed RSI for 1970s commodity and stock markets. Crypto is different in ways that matter:
- Markets never close. There are no weekends or sessions to reset momentum, so RSI runs continuously.
- Volatility is far higher. Crypto routinely moves 5–10% in a day. That means RSI reaches the extremes more often and stays there longer than it would on equities.
- Trends are more violent. A coin in a parabolic move can sit above 80 for an extended stretch — selling the first "overbought" print is a classic way to get run over.
Because of this, many crypto traders widen the thresholds to 80/20 instead of 70/30 to cut down on false signals, and lean more heavily on the 50 centerline and on divergence (below) than on the raw extremes.
Practical RSI strategies that work
1. Divergence
The highest-quality RSI signal. Divergence occurs when price and RSI disagree:
- Bearish divergence: price makes a higher high but RSI makes a lower high. The new price high has less momentum behind it — a warning that the uptrend is tiring.
- Bullish divergence: price makes a lower low but RSI makes a higher low. Selling pressure is fading even as price drops — a common precursor to a bounce.
Divergence works best on higher timeframes (4H and above) where noise is reduced.
2. The 50-line trend filter
In an uptrend, RSI tends to hold above 50 and bounce off it. In a downtrend, it caps below 50. Using 50 as a filter — only taking long setups while RSI > 50 — keeps you aligned with momentum instead of fighting it.
3. Failure swings
Wilder's own signal, independent of price. A bullish failure swing: RSI drops below 30, bounces, pulls back but holds above 30, then breaks its prior RSI peak. It signals that downside momentum has structurally broken.
4. Trend confirmation
Rather than using RSI to pick reversals, use it to confirm what price is already doing. A breakout backed by RSI pushing through 60–70 has real momentum; a breakout on falling RSI is suspect.
Common RSI pitfalls
- Selling the first overbought print in a strong trend. In parabolic crypto moves, RSI can stay pinned above 70 (or 80) for a long time. Overbought is a description of strength, not a top.
- Trusting RSI in a ranging market for trend signals — or trusting it in a strong trend for reversal signals. Match the tool to the regime.
- Over-optimizing the period. Chasing a "perfect" RSI length curve-fits to the past. Stick with 14 (or a deliberate 7/21) and let the signal quality come from context.
- Using RSI alone. RSI is a momentum lens, not a complete system. Pair it with structure, volume, and moving averages.
The multi-coin problem — and the RSI heatmap
Here's the practical bottleneck: RSI is genuinely useful, but crypto has thousands of tradable assets. Opening 50 charts one by one to check each RSI is slow, and by the time you've finished, the readings have moved.
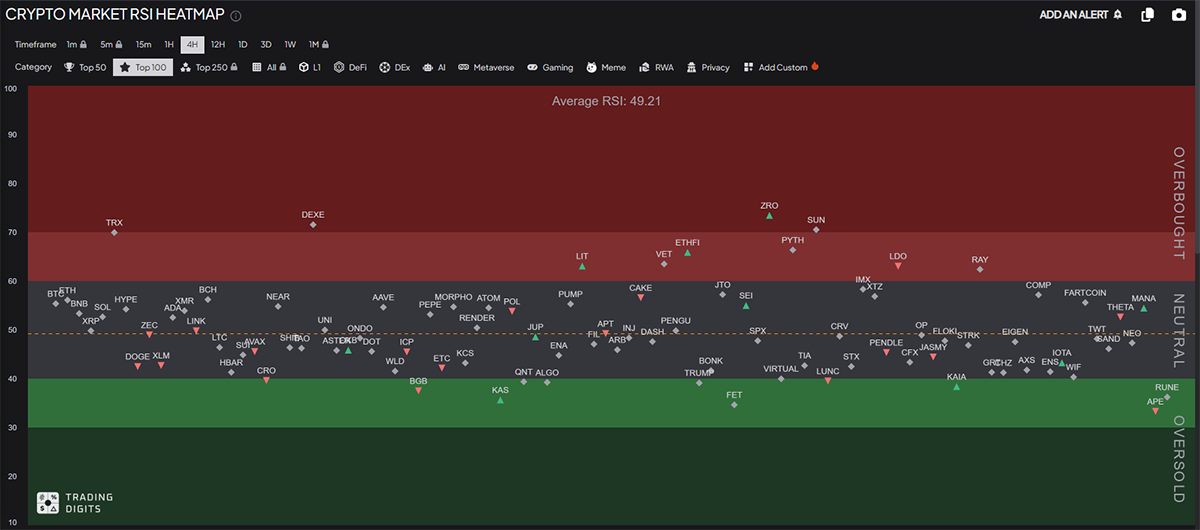
That's exactly what an RSI heatmap solves. Instead of one chart at a time, it computes RSI for 50+ tokens simultaneously and color-codes them on a single screen — deep red for oversold, deep green for overbought — so you can see where momentum is concentrated across the whole market at a glance.
How to use the Trading Digits RSI Heatmap
The Trading Digits RSI Heatmap is built for exactly this workflow:
- 50+ tokens, one view. Every major asset's RSI is calculated server-side and rendered as a color grid — no opening individual charts.
- Multiple timeframes. Switch between short-term and higher-timeframe RSI to line up intraday momentum with the bigger trend.
- Instant scanning. Spot clusters — for example, when the entire market goes oversold together (a potential capitulation) versus a single coin diverging from the pack.
- Faster shortlisting. Use the heatmap to narrow thousands of coins down to the handful worth opening a full chart on.
The heatmap doesn't replace reading an individual chart — it replaces the tedious part: finding which charts are worth reading right now.
Frequently asked questions
What is a good RSI setting for crypto? The default 14-period RSI is the standard and works well across timeframes. Because crypto is more volatile than traditional markets, many traders widen the overbought/oversold thresholds from 70/30 to 80/20 rather than changing the period itself.
Does RSI above 70 mean I should sell? No. An RSI above 70 means momentum has been strongly bullish, not that a top is in. In strong crypto uptrends, RSI can stay overbought for a long time. Treat 70+ as a condition to watch, ideally alongside divergence or a break of market structure — not as a standalone sell signal.
What is RSI divergence? Divergence is when price and RSI move in opposite directions. If price makes a higher high but RSI makes a lower high (bearish divergence), the move is losing momentum. If price makes a lower low but RSI makes a higher low (bullish divergence), selling pressure is fading. It's widely considered RSI's highest-quality signal.
Why use an RSI heatmap instead of a normal RSI indicator? A standard RSI shows one asset at a time. An RSI heatmap computes RSI for 50+ coins at once and color-codes them, so you can see where momentum is concentrated across the whole market in a single glance — turning a slow, chart-by-chart check into an instant scan.
Conclusion
RSI is powerful precisely because it measures something the price chart can't show you directly: the momentum behind a move. Read it as a condition rather than a signal, respect that crypto trends can stay stretched far longer than intuition suggests, and lean on divergence and the 50-line rather than blindly fading the extremes.
Then scale it. Once you're comfortable reading a single RSI, the RSI Heatmap lets you apply that same read to the entire market at once — and pairs naturally with the EMA/SMA Screener, Bollinger Bands Screener, and Supertrend Scanner for a fuller momentum-and-trend picture.