
Liquidation Heatmap API: Levels and Clusters in Python and JavaScript
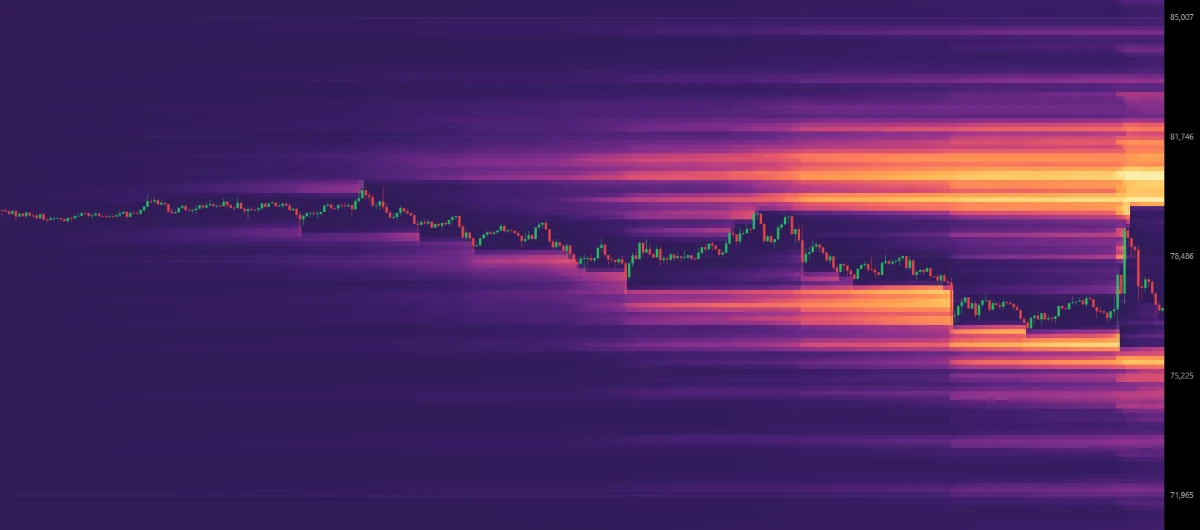
The Trading Digits liquidation heatmap API returns the liquidation heatmap of every Binance USDT-M perpetual as JSON: the liquidation levels standing now, the largest liquidation clusters over the period, and the full heatmap grid with its price candles. It covers the last 24 hours, 3, 7 or 30 days, is updated every minute, and gives estimated liquidation amounts in USD. This guide shows how to call it with curl, Python and JavaScript, and how to turn the answers into something useful: the nearest clusters above and below the price, an alert when price approaches one, and a heatmap you draw yourself.
Key takeaways
- Three endpoints:
/liquidation-heatmap/levels(what stands now),/liquidation-heatmap/clusters(the largest clusters and what happened to them) and/liquidation-heatmap(the whole grid).- Every Binance USDT-M perpetual (about 520), for
24h,3d,7dor30d, refreshed every minute.- Part of the Dev plan, with commercial use and an MCP server for AI assistants.
- Plain HTTPS and JSON: any language works. The examples below use curl, Python and JavaScript (Node).
New to liquidation heatmaps? Start with What is a crypto liquidation heatmap and how to use it, or open the live liquidation heatmap to see the data this API serves.
What the liquidation heatmap API returns
| Endpoint | What it answers | Main fields |
|---|---|---|
GET /api/v1/liquidation-heatmap/levels | The liquidation levels standing now, largest first | price_low, price_high, side (long or short), value_usd |
GET /api/v1/liquidation-heatmap/clusters | The largest clusters over the period: standing, swept by the price, or faded | status, value_usd, peak_usd, formed_at, ended_at, distance_pct, history_usd |
GET /api/v1/liquidation-heatmap | The full heatmap: 340 price bands across time, with each column's price candle | times, levels[].values, candles |
Every endpoint takes symbol (a Binance USDT-M perpetual, such as BTCUSDT) and period (24h, 3d, 7d or 30d, default 24h). Longs are liquidated below the price, shorts above it. Every answer has the same shape: data, and meta with as_of (when the heatmap was last updated) and stale (true if an update is late). The API documentation lists every parameter and field.
Before you start
- Get a key. The liquidation heatmap endpoints are part of the Dev plan. Create a key on your account page; it is shown once, so store it safely.
- Keep it out of your code. The examples read it from an environment variable,
TD_API_KEY. - Use the base URL exactly, with www:
https://www.tradingdigits.io/api/v1. HTTP clients drop the key when a redirect changes the host, so the address without www would answer 401. - Send the key in a header,
Authorization: Bearer <key>(orX-API-Key: <key>), never in the URL.
Example 1: the liquidation levels standing now
The quickest way in: the price bands holding the largest estimated liquidations right now.
With curl:
curl "https://www.tradingdigits.io/api/v1/liquidation-heatmap/levels?symbol=BTCUSDT&period=24h&limit=3" \
  -H "Authorization: Bearer $TD_API_KEY"
The answer (shortened):
{
  "data": [
    { "price_low": 63032.36144, "price_high": 63068.64643, "side": "long", "value_usd": 20421840 },
    { "price_low": 62996.07646, "price_high": 63032.36144, "side": "long", "value_usd": 17746336 },
    { "price_low": 65572.31029, "price_high": 65608.59527, "side": "short", "value_usd": 16150289 }
  ],
  "meta": { "symbol": "BTCUSDT", "period": "24h", "as_of": "2026-11-18T05:13:00.224Z", "stale": false, "price": 64474.8, "count": 3 }
}
In Python, with the distance of each level from the price:
import os
import requests

BASE = "https://www.tradingdigits.io/api/v1"
HEADERS = {"Authorization": f"Bearer {os.environ['TD_API_KEY']}"}

r = requests.get(
    f"{BASE}/liquidation-heatmap/levels",
    params={"symbol": "BTCUSDT", "period": "24h", "limit": 10},
    headers=HEADERS,
    timeout=30,
)
r.raise_for_status()
body = r.json()
price = body["meta"]["price"]

for level in body["data"]:
    mid = (level["price_low"] + level["price_high"]) / 2
    print(f'{level["side"]:5}  {mid:>12,.2f}  ${level["value_usd"]:>14,.0f}  {100 * (mid / price - 1):+.2f}%')
The same in JavaScript (Node 18 or later, in an ES module):
const BASE = "https://www.tradingdigits.io/api/v1";
const headers = { Authorization: `Bearer ${process.env.TD_API_KEY}` };

const res = await fetch(`${BASE}/liquidation-heatmap/levels?symbol=BTCUSDT&period=24h&limit=10`, { headers });
if (!res.ok) throw new Error(`${res.status}: ${await res.text()}`);
const { data, meta } = await res.json();

for (const level of data) {
  const mid = (level.price_low + level.price_high) / 2;
  const away = (100 * (mid / meta.price - 1)).toFixed(2);
  console.log(level.side.padEnd(5), mid.toFixed(2), `$${Math.round(level.value_usd).toLocaleString("en-US")}`, `${away}%`);
}
Example 2: the nearest liquidation clusters above and below the price
Single bands are noisy; clusters are what traders watch. The clusters endpoint groups neighbouring bands, ranks them, and tells you what happened to each: standing (still there), swept (the price traded into it) or faded (it shrank without the price reaching it). distance_pct is the distance from the price now to the cluster's nearer edge: positive above the price, negative below, 0 when the price is inside it.
In Python:
r = requests.get(
    f"{BASE}/liquidation-heatmap/clusters",
    params={"symbol": "ETHUSDT", "period": "7d", "limit": 10},
    headers=HEADERS,
    timeout=30,
)
r.raise_for_status()
clusters = r.json()["data"]
standing = [c for c in clusters if c["status"] == "standing"]

above = min((c for c in standing if c["distance_pct"] > 0), key=lambda c: c["distance_pct"], default=None)
below = max((c for c in standing if c["distance_pct"] < 0), key=lambda c: c["distance_pct"], default=None)

for name, c in (("Above", above), ("Below", below)):
    if c:
        print(f'{name}: {c["price_low"]:,.2f}-{c["price_high"]:,.2f}, ${c["value_usd"]:,.0f}, {c["distance_pct"]:+.2f}% away')
In JavaScript, as a small alert that fires when the price comes within 1% of a large standing cluster:
const res = await fetch(`${BASE}/liquidation-heatmap/clusters?symbol=SOLUSDT&period=3d&limit=10`, { headers });
if (!res.ok) throw new Error(`${res.status}: ${await res.text()}`);
const { data: clusters } = await res.json();

const close = clusters.filter((c) => c.status === "standing" && Math.abs(c.distance_pct) <= 1 && c.value_usd >= 5_000_000);
for (const c of close) {
  console.log(`${c.side} cluster ${c.price_low.toFixed(3)}-${c.price_high.toFixed(3)}: $${Math.round(c.value_usd).toLocaleString("en-US")}, ${c.distance_pct}% away`);
}
Each cluster also carries history_usd, its value at the eight times in meta.history_times, so you can see whether a cluster has been building up or shrinking.
Example 3: draw the liquidation heatmap yourself
The grid endpoint returns the whole heatmap: times (each column's time, oldest first), levels (the price bands, lowest first, each with one value per column in USD) and candles (the perpetual's price candle of each column). A 24-hour grid is 340 bands by 288 columns. Add resolution=coarse for a lighter version: 34 bands and one column per hour (24h), 2 hours (3d), 4 hours (7d) or day (30d).
In Python, with NumPy and Matplotlib:
import numpy as np
import matplotlib.pyplot as plt

r = requests.get(
    f"{BASE}/liquidation-heatmap",
    params={"symbol": "BTCUSDT", "period": "24h", "resolution": "coarse"},
    headers=HEADERS,
    timeout=60,
)
r.raise_for_status()
grid = r.json()["data"]

values = np.array([band["values"] for band in grid["levels"]])  # rows: price bands, columns: times
low, high = grid["levels"][0]["price_low"], grid["levels"][-1]["price_high"]
closes = [candle["close"] for candle in grid["candles"]]

fig, ax = plt.subplots(figsize=(12, 6))
ax.imshow(values, aspect="auto", origin="lower", cmap="inferno", extent=[0, len(grid["times"]), low, high])
ax.plot(np.arange(len(closes)) + 0.5, closes, color="white", linewidth=1)
ax.set_ylabel("Price (USDT)")
ax.set_title("BTCUSDT liquidation heatmap, last 24 hours")
plt.show()
In JavaScript, the bands that held the most over the period, and what they hold now:
const res = await fetch(`${BASE}/liquidation-heatmap?symbol=BTCUSDT&period=3d&resolution=coarse`, { headers });
if (!res.ok) throw new Error(`${res.status}: ${await res.text()}`);
const { data: grid } = await res.json();

const last = grid.times.length - 1;
const bands = grid.levels.map((band) => ({
  low: band.price_low,
  high: band.price_high,
  peakUsd: Math.max(...band.values),
  nowUsd: band.values[last],
}));
bands.sort((a, b) => b.peakUsd - a.peakUsd);
console.table(bands.slice(0, 5));
Polling and limits
- Ask once a minute at most. The heatmap is updated every minute; compare
meta.as_ofwith the one you already have. - Respect
Retry-After. When the heatmap is busy, a request is answered503withRetry-After; it does not count against your plan. Over your plan's requests a minute you get429, also withRetry-After. - Ask only for what you need.
/levelsand/clustersanswer in a few kilobytes and the coarse grid in about ten; the full grid runs to several hundred kilobytes.
A small Python helper that waits as the API asks:
import time

def get(path, **params):
    for attempt in range(5):
        r = requests.get(f"{BASE}{path}", params=params, headers=HEADERS, timeout=60)
        if r.status_code not in (429, 503) or attempt == 4:
            break
        if "monthly_quota_exceeded" in r.text:  # resets on the 1st: no point waiting
            break
        time.sleep(int(r.headers.get("Retry-After", "5")))
    r.raise_for_status()
    return r.json()

levels = get("/liquidation-heatmap/levels", symbol="BTCUSDT", period="24h")
Liquidation heatmap data in AI assistants
On the Dev plan, the Trading Digits MCP server gives Claude, ChatGPT, Cursor and other MCP apps three liquidation tools: get_liquidation_levels, get_liquidation_clusters and get_liquidation_heatmap (the compact grid). Connect it once, then ask in plain language: "Where are the largest liquidation clusters on ETH this week, and has the price swept any of them?"
Other languages
The API is plain HTTPS and JSON, so anything that can send an HTTP request works the same way: Go, Rust, PHP, C#, Java, Ruby, a spreadsheet with a web query, or no-code tools such as n8n and Make. Send the key in the Authorization header and read data and meta from the answer.
Frequently asked questions
Is there a free liquidation heatmap API?
No. The liquidation heatmap endpoints are part of the Dev plan, which also allows commercial use and includes the MCP server. The live liquidation heatmap on the site stays free to view.
Which markets does the liquidation heatmap API cover?
Every Binance USDT-M perpetual, about 520, from Bitcoin and Ethereum to smaller altcoins. /api/v1/symbols lists them under perpetuals.
How often is the liquidation heatmap data updated?
Every minute. Each answer's meta.as_of says when the heatmap was last updated, and meta.stale turns true if an update is late.
What periods can I request?
The last 24 hours, 3 days, 7 days or 30 days, with the period parameter.
Are the values real liquidations?
No. They are estimated liquidation amounts in USD: where liquidations would happen if the price got there, not a record of liquidations that already happened.
Can I use the data in my own product?
Yes, on the Dev plan, which allows commercial use under the Data API Terms: you can build the levels and clusters into your own app, bot or dashboard.
Ready to start? See the Dev plan and the liquidation heatmap API docs.